Signs Your CPU May Be Overworked
Do you know How to check CPU usage?When your computer starts to feel sluggish, the CPU might be working too hard. Here are signs to watch for:
- Frequent Freezes or Crashes: If your computer often stops responding or crashes, the CPU may be strained.
- Loud Fan Noises: A CPU under heavy load can cause the cooling fan to work overtime, leading to increased noise.
- Slow Task Completion: Tasks that once were quick but now take longer could point to a taxed CPU.
- High CPU Temperature: Heat is a byproduct of intense CPU activity. Tools can check CPU temperature to confirm this.
- Performance Lag During Basic Tasks: If simple tasks like opening a browser slow down your PC, it might be the CPU.
- Spinning Cursor or Loading Icon: Frequent sightings of the spinning cursor suggest your CPU struggles with current demands.
Keep an eye out for these symptoms. If they persist, it’s time to investigate your CPU usage. Next, we’ll see how using the Windows Task Manager can help monitor your CPU’s performance.
How to Use Windows Task Manager for CPU Monitoring
Monitoring your CPU usage is crucial to maintaining your PC’s health and performance. The Windows Task Manager is a readily accessible tool that allows you to check how much of your CPU’s capacity is in use at any time. Here’s a straightforward guide to using Task Manager to monitor your CPU’s performance:
- Open Task Manager: Use the shortcut Ctrl + Shift + Escape, or right-click on the taskbar and select ‘Task Manager’.
- Switch to the Performance Tab: Once open, navigate to the ‘Performance’ tab where you will find a real-time graph of your CPU’s activity.
- Evaluate CPU Utilization: Check the percentage shown in the CPU usage graph. This gives you a snapshot of your CPU’s current workload.
- Examine Core Usage: Click on ‘CPU’ on the left-hand side to view a detailed breakdown of the usage across individual cores or threads if you have a multi-core processor.
By following these steps, you can detect if your CPU is overworked or spot potential performance issues. If you see regular spikes to 100% utilization, it could be a sign of processes or applications demanding too much from your CPU and resulting in sluggish performance. Understanding how to read and interpret this data is key to diagnosing and solving your PC’s slowdowns.
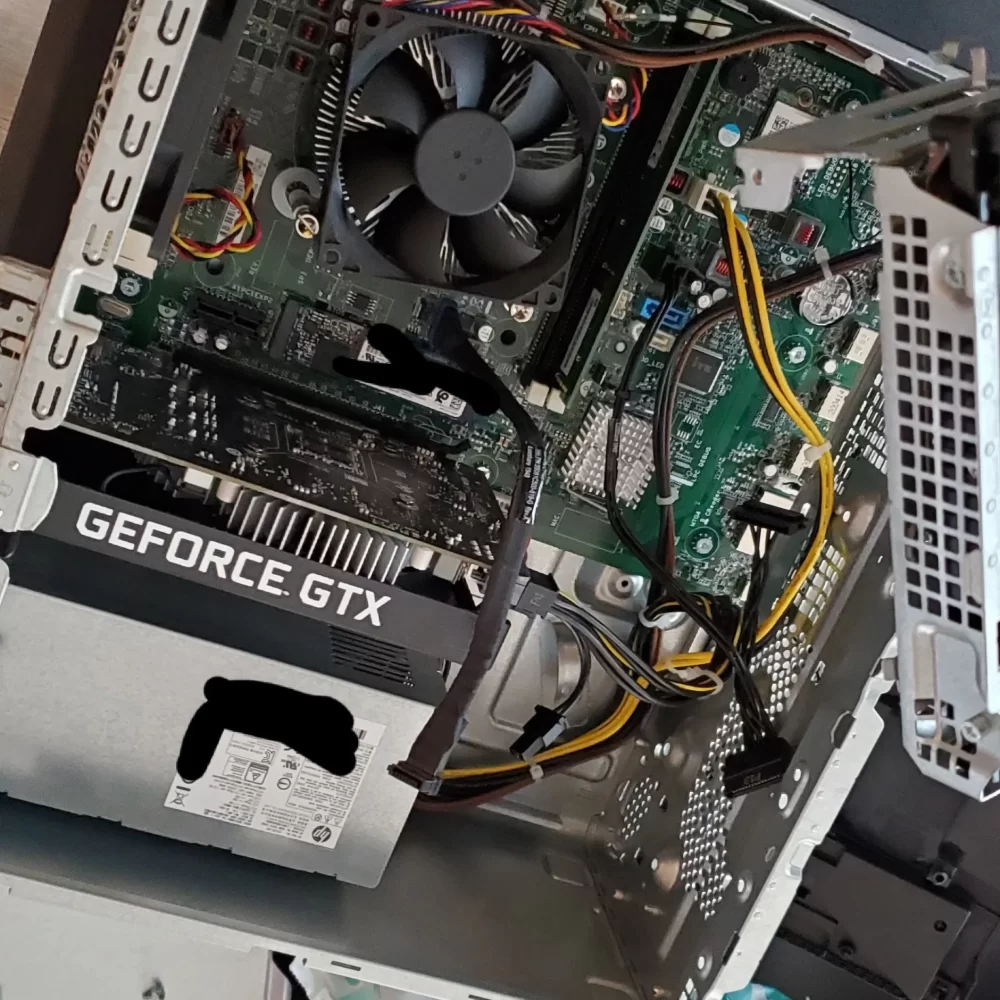
Understanding Task Manager’s Performance Tab
The Performance Tab in Task Manager is your CPU’s activity center. Here’s how to make sense of it:
- Total CPU Usage: A graph displays your total CPU usage over time. Look for trends.
- Individual Core Analysis: Delve deeper by examining each core’s load, especially for multi-core CPUs.
- CPU Speed: Monitor how fast your CPU is running in GHz.
- Up-Time: See how long your PC has been on since the last restart.
- Resource Details: Find details like the number of threads, handles, and processes in action.
By understanding the Performance tab, you become better equipped to spot issues and keep your CPU running efficiently. Check it regularly to prevent CPU overwork.
Monitoring CPU Usage with the Xbox Game Bar
If you’re engaged in full-screen activities like gaming, it’s useful to check your CPU usage without minimizing your app. The Xbox Game Bar in Windows is a built-in feature that lets you track your CPU performance while remaining in your full-screen experience. Here’s a quick guide on how to use this tool effectively:
- Activate Xbox Game Bar: Press
Win + Gon your keyboard to bring up the overlay. - Locate the Performance Widget: You’ll find the CPU usage displayed on one of the widgets. If it’s not visible, you may have to add it from the widgets menu.
- Position the Widget: Drag the Performance widget where it won’t block important screen elements.
- Pin the Widget: To keep it visible, click the pin button. This keeps the widget on-screen even when you dismiss the Game Bar.
- Close Xbox Game Bar: Once pinned, close the overlay by pressing
Win + Gagain. Your Performance widget will remain visible. - Unpinning the Widget: Should you want to remove it, reopen the Game Bar and unpin the widget.
Using the Xbox Game Bar for monitoring CPU usage is not only convenient for full-screen applications but also offers a seamless way to ensure your CPU isn’t the bottleneck during gaming or other intensive tasks. It’s a non-intrusive method that allows real-time monitoring without interrupting your workflow.
Advanced CPU Usage Tracking with MSI Afterburner
For those who need detailed, real-time CPU usage data, MSI Afterburner is a top choice. This application is not only for enhancing your PC’s graphics performance but also for monitoring your CPU’s intricate operations. How to check CPU usage effectively? Here’s a simple step-by-step process:
- Download and Install: Go to MSI’s website and download MSI Afterburner. Install it, ensuring to include RivaTuner Statistics Server (RTSS).
- Launch MSI Afterburner: Open the application and grant necessary permissions if prompted.
- Access Settings: Click on the settings cog to enter the properties area where you can adjust monitoring tools.
- Choose CPU Metrics: In the monitoring tab, select ‘CPU Usage’ for each core you wish to track.
- Show in On-screen Display: Mark the ‘Show in on-screen display’ option to view real-time CPU usage while running applications.
- Customize Hotkey: Set a convenient hotkey for toggling the on-screen display during gameplay or other tasks.
- Launch Your Game: Start your game or any CPU-intensive program and watch as MSI Afterburner displays your CPU metrics.
- Analyze Usage: Observe the individual core utilization which can help identify bottlenecks or uneven load distribution.
By getting familiar with MSI Afterburner, you can keep a vigilant eye on your CPU’s performance, especially during gaming or heavy multitasking. This knowledge can aid in optimizing settings for smoother operation.
Utilizing HWInfo64 for Detailed CPU Usage History
Keeping track of your CPU usage over time can offer valuable insights. HWInfo64 is a powerful tool that provides a detailed history of CPU usage, which can help you pinpoint performance trends and diagnose issues. Here’s how to make the most of HWInfo64 for tracking your CPU usage history:
- Download HWInfo64: Visit the official website and grab the installation file. Choose between the installer or portable version.
- Launch and Initiate: Run HWInfo64 and hit ‘Start’. It may take a moment to gather all system data.
- Monitor in Real-Time: Look at the ‘Sensor Status’ window to see live CPU usage stats.
- Record Sessions: Use the ‘Start Logging’ button to begin recording CPU activity data to a CSV file.
- Save Log for Analysis: Decide on a storage location that’s easy to find later.
- Analyze the Data: Stop logging when ready. Open the CSV in a spreadsheet program and study CPU usage patterns.
- Identify Issues: Compare logged data with performance issues you’ve noted. This helps find causes.
By regularly using HWInfo64, you’ll develop a clear picture of your CPU’s historical activity. This proactive approach can be instrumental in optimizing PC performance.
Interpreting Resource Monitor Results for CPU Load
Understanding the Resource Monitor’s results helps diagnose CPU load issues. The tool offers detailed views not seen in Task Manager. To use Resource Monitor for checking CPU load, follow these steps:
- Launch Resource Monitor: Hit
Win + R, typeresmon, and press enter. - Inspect CPU Tab: Select the CPU tab to view detailed usage stats.
- Review Processes: Check processes for high CPU demand. Sort by CPU to identify top consumers.
- Examine Services: Pay attention to associated services. Some might use more CPU than expected.
- Analyze Performance: View graphs for overall CPU utilization. Spot spikes and unusual patterns.
- Check Threads: Look at individual threads tied to processes. High activity may signal issues.
- Note Resource Waits: If resources wait is high, bottlenecks could be present.
- Close or Restart Tasks: End or restart tasks consuming excessive CPU, if safe to do.
Resource Monitor uncovers hidden processes affecting performance. With it, users pinpoint problems causing CPU load spikes. It allows in-depth analysis over time compared to Task Manager’s snapshot view. Regular checks can alert users to potential overloads before they impact system performance.
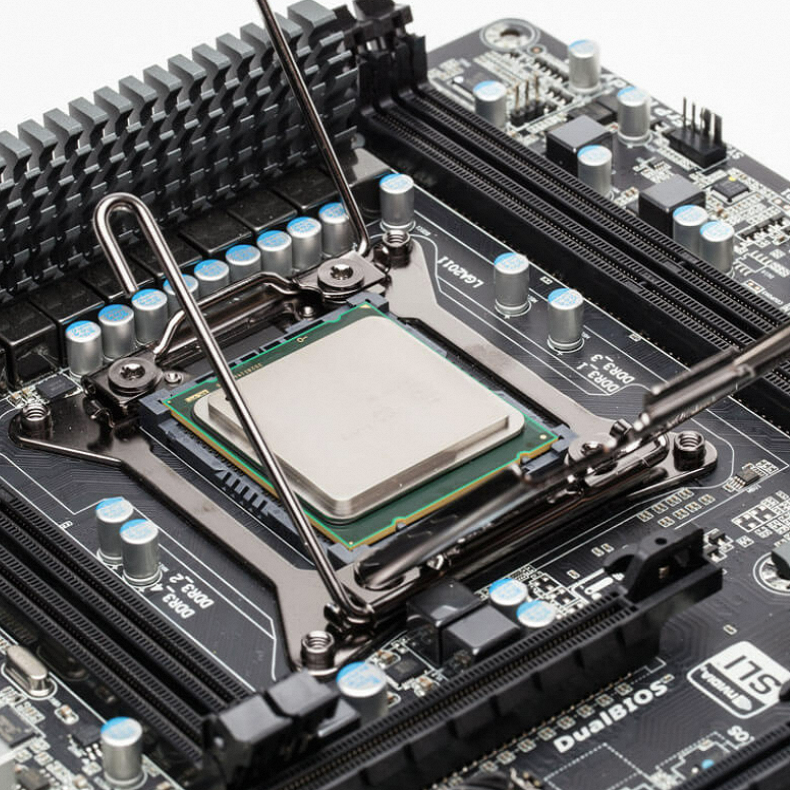
The Role of CPU Usage in Diagnosing PC Slowdowns
Detecting why your computer is running slow can often feel like a challenging puzzle. One key piece of that puzzle is CPU usage, which is a crucial factor in discovering the root causes of a PC’s sluggish performance. Understanding and monitoring CPU utilization can give you insights into whether the processor is overburdened by tasks, allowing you to take appropriate action.
When your PC is slow, checking the CPU load should be one of your first steps. If the CPU usage is consistently high, this indicates that it’s handling more processes than it’s equipped to manage efficiently. Identifying the processes that are consuming significant CPU resources can help you decide whether to close unnecessary applications or take other measures.
In certain cases, high CPU usage could point to more serious issues, such as malware infections or failing hardware components. Monitoring tools such as Task Manager, MSI Afterburner, or HWInfo64 can help highlight abnormalities in CPU performance. Regular checks ensure that you stay ahead of potential problems, contributing to a smoother and more efficient computing experience.
It’s also essential to consider the age and capability of your CPU. Older processors may struggle with newer software demands, which could mean it’s time for an upgrade. By keeping an eye on how your CPU handles various tasks, you can better understand its limits and enhance your PC’s overall performance.
In summary, How to check CPU usage is a telling indicator of your computer’s health and efficiency. Efficient monitoring can prevent slowdowns before they become disruptive, guaranteeing a more responsive and dependable PC.
